Related Post
How Cryo-Electron Tomography (Cryo-ET) Makes Subtomogram Averaging Work
2026-02-23Cryo-Electron Tomography (Cryo-ET) is the method researchers turn to when they need true 3D context—structures inside cells, at membranes, or within viral assemblies—without forcing biology into an artificial, purified “average” too early.
Cryo-Electron Tomography - an overview | ScienceDirect Topics
What is Cryo-Electron Tomography (Cryo-ET)?
Cryo-Electron Tomography (Cryo-ET) is a cryo-EM method that makes 3D “CT-scan–like” images of biological samples—such as cells, viruses, or large protein assemblies—while they are flash-frozen in a near-native state.
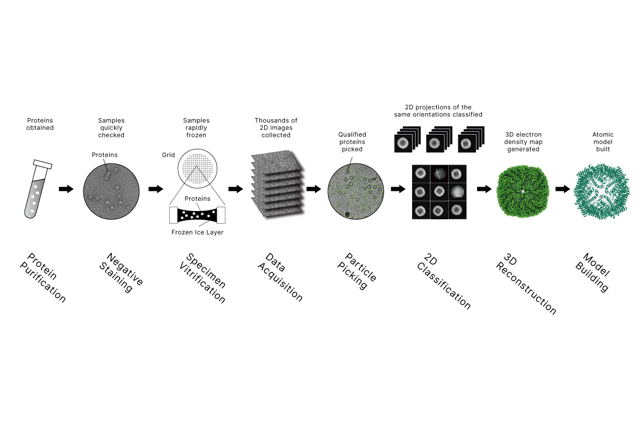
Here’s the idea in simple steps:
• Freeze fast: The sample is rapidly frozen so water forms vitreous ice (no crystals), helping preserve natural structure.
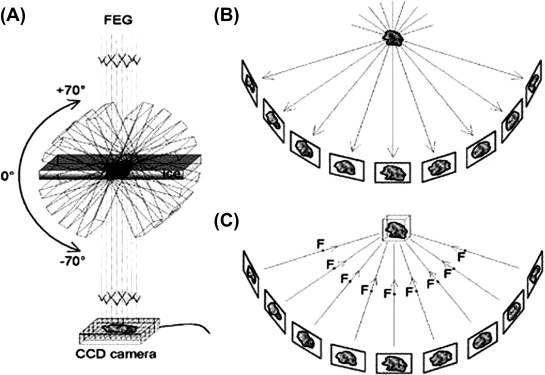
• Tilt and image: In a transmission electron microscope, the sample is imaged many times while it is tilted through a range of angles.
• Reconstruct 3D: Software combines those 2D tilt images into a 3D volume called a tomogram.
Why we use Cryo-ET:
• It shows structures in context (inside cells or on membranes), not just purified particles.
• It captures spatial organization—how molecules are arranged and interact.
• It is especially useful for large complexes, membrane-associated assemblies, and viral/cellular architectures.
Why Subtomogram Averaging Exists in Cryo-ET
Cryo-ET produces a 3D volume (a “tomogram”) by combining many tilted views of the same frozen specimen. It is powerful because it preserves near-native organization. The challenge is that each tomogram is noisy, and many targets inside cells appear only a few times per volume.
Subtomogram averaging solves this by extracting many small 3D sub-volumes (subtomograms) that contain the same complex, then aligning and averaging them so signal adds up and noise cancels out. In simple terms: you trade “one noisy copy” for “many aligned copies,” and your structure becomes clearer with every good particle you add.
At Longlight Technology, we explain it to new teams like this: Cryo-ET gives you the where and how it is arranged, while subtomogram averaging delivers the what it looks like in detail—in the same dataset.
How Cryo-ET Data Becomes a Subtomogram Average
What is Subtomogram Average?
A Subtomogram Average is a sharpened 3D structure made by taking many small 3D cutouts from cryo-electron tomography data and aligning + averaging them to reduce noise.
Here’s the simple picture:
Cryo-ET gives a tomogram (a noisy 3D volume).
You find repeated copies of the same target (for example, the same ribosome, viral spike, or membrane complex) inside that tomogram—or across many tomograms.
You extract a small 3D box around each copy. Each box is a subtomogram.
You rotate and shift all subtomograms so the target lines up in the same orientation (alignment).
You average them. Signal adds up, random noise cancels out → you get a clearer 3D map: the subtomogram average.
The workflow is logical when you view it as a chain of quality gates, not a black box.
How Cryo-ET Becomes a Reliable 3D Density
First, Cryo-ET collects a tilt series. That series is reconstructed into a tomogram. Then the subtomogram process begins:
✓ Identify repeated targets (manually, template-based, or assisted detection)
✓ Extract small volumes around each target
✓ Align those volumes into a shared orientation
✓ Classify to separate different states or conformations
✓ Average to generate a higher-quality 3D density
A key lesson for beginners: subtomogram averaging is not only about “more particles.” It is about consistent particles. If your target has multiple shapes, conformations, or binding partners, classification becomes the step that turns heterogeneity into insight rather than confusion.
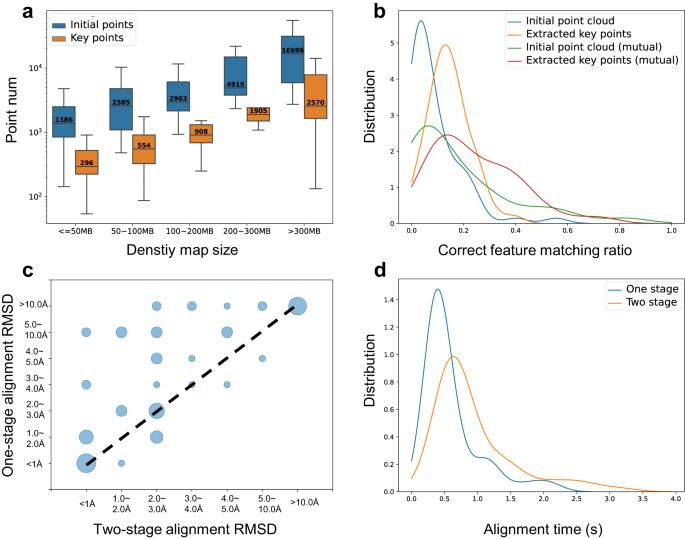
Accurate global and local 3D alignment of cryo-EM density maps using local spatial structural feature
Sample Readiness: The Quiet Factor That Controls Resolution
Many Cryo-ET projects succeed or fail before the microscope session begins. Good subtomogram averaging depends on having enough usable copies of the same structure, in a stable buffer, and with particle behavior that supports reliable alignment.
Longlight’s service starts with practical screening, because it protects your time and budget. A common quality-control step is negative stain assessment, performed at room temperature and low voltage, to check homogeneity, aggregation, particle morphology, size, and distribution. This is a fast way to decide whether a sample is ready for Cryo-Electron Tomography (Cryo-ET) data acquisition.
For clients who ask, “How much sample do we need to start?” we provide a clear baseline:
✓ Minimal concentration: ~1 g/L
✓ Minimal volume: ~100 µL (negative stain and typical SPA preparation)
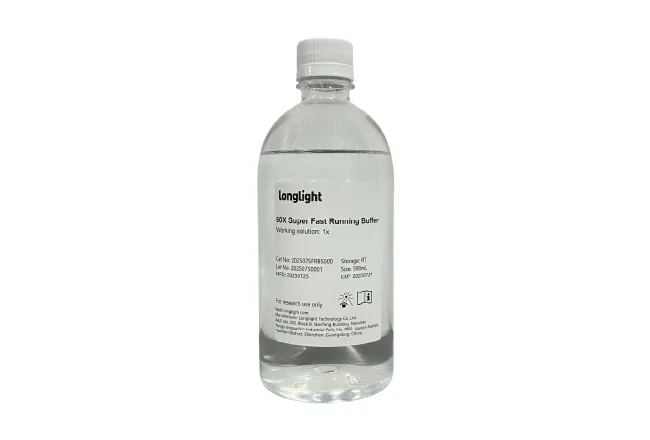
Buffer choices also matter. For many projects, a workable target range is:
✓ pH 6.0–8.5
✓ Salt <200 mM
These numbers are not arbitrary. They reduce avoidable instability and help samples behave predictably during grid preparation and imaging. When your particles stay consistent, subtomogram alignment becomes easier, and averaging becomes more meaningful.
Instrument Choice: Matching the Platform to Your Cryo-ET Goal
Not every Cryo-ET job needs the same platform. Subtomogram averaging benefits from stable imaging, reproducible tilt series collection, and strong automation—especially when you want throughput.
Longlight Technology supports Cryo-Electron Tomography (Cryo-ET) and related workflows using three major systems:
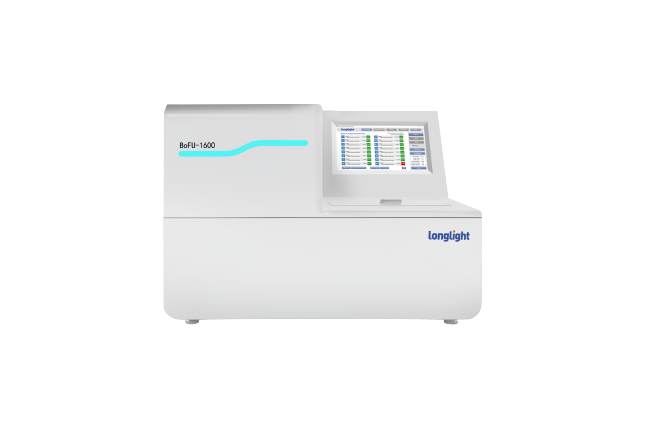
• Talos L120C G2: an entry-level TEM and cryo-EM screening platform that helps teams verify sample behavior early
• Glacios 2 (200 kV): a workhorse cryo-EM system optimized for routine single-particle and tomography workflows
• Titan Krios G4 (300 kV): a flagship platform designed for maximum stability, automation, throughput, and resolution potential
From a customer perspective, the advantage is practical: you do not have to “over-buy” microscope time. Screening can happen on the right platform first, then the project can move to higher-end capacity when the data can truly benefit from it.
Deliverables That Make Subtomogram Averaging Reproducible
A subtomogram average is only as useful as the evidence behind it. If your downstream team cannot review intermediate steps, validate decisions, or re-run key processing, the final map becomes hard to trust and harder to publish.
Longlight’s standard delivery emphasizes transparency and continuity across the project lifecycle. Delivered materials can include:
✓ Raw cryo-EM movies with gain reference files
✓ Intermediate data files at multiple processing stages
✓ Final 3D density maps with resolution and quality metrics
✓ Atomic coordinate models (when applicable)
✓ Cross-validation reports (for example, MolProbity assessments)
This matters for subtomogram averaging because alignment, classification, and averaging parameters can change interpretations. With complete deliverables, your team can defend choices, iterate later, and build a stronger story around structure-function relationships.
A One-Stop Cryo-ET Service Workflow With Clear Timelines
For teams new to Cryo-Electron Tomography (Cryo-ET), a predictable workflow reduces risk. Our typical service path is:
Project consultation → NDA signing → service agreement confirmation → sample receiving → quality inspection → negative stain screening → cryo-EM data collection → data processing → report delivery
We also keep timelines realistic and easy to plan around:
• Negative staining: 1–2 weeks
• SPA preliminary results: 6–8 weeks
• SPA high-resolution model: 2–3 months
Cryo-ET timelines depend on sample complexity and the subtomogram strategy, but the guiding principle is the same: we aim for balanced delivery—fast enough to keep research moving, and thorough enough to keep data reliable.
CTA (Call-to-Action): If you are planning a Cryo-Electron Tomography (Cryo-ET) project where subtomogram averaging is critical—such as membrane complexes, large assemblies, or in situ viral mechanisms—contact Longlight Technology for a project consultation and a free quote. Share your target type, expected copy number, and buffer conditions, and we will recommend a workflow that turns your tomograms into interpretable averages, not just attractive images.